Read your website in 10 minutes a month with Claude
Export Search Console and GA4, paste a prompt into Claude and get a dashboard with your branding, every metric explained in plain business language and a 30-day action plan. Free, no sign-up.
Read your website in 10 minutes a month with Claude
A 6-page guide that shows you how to export your Google Search Console and Google Analytics 4 reports, plus a ready-to-paste prompt for Claude that gives you back a dashboard with your branding, explains every number in plain business language and hands you a 30-day action plan. Without relying on your agency, or on us.
- How to export Search Console and GA4 step by step, as a Sheets link or as a CSV.
- The full prompt, with a data quality check before anything gets interpreted.
- A real example built with our own website, problems included.
- A one-minute glossary and the most common mistakes.
Free, no sign-up. If you share it, please credit the source. Version 1.0, October 2026.
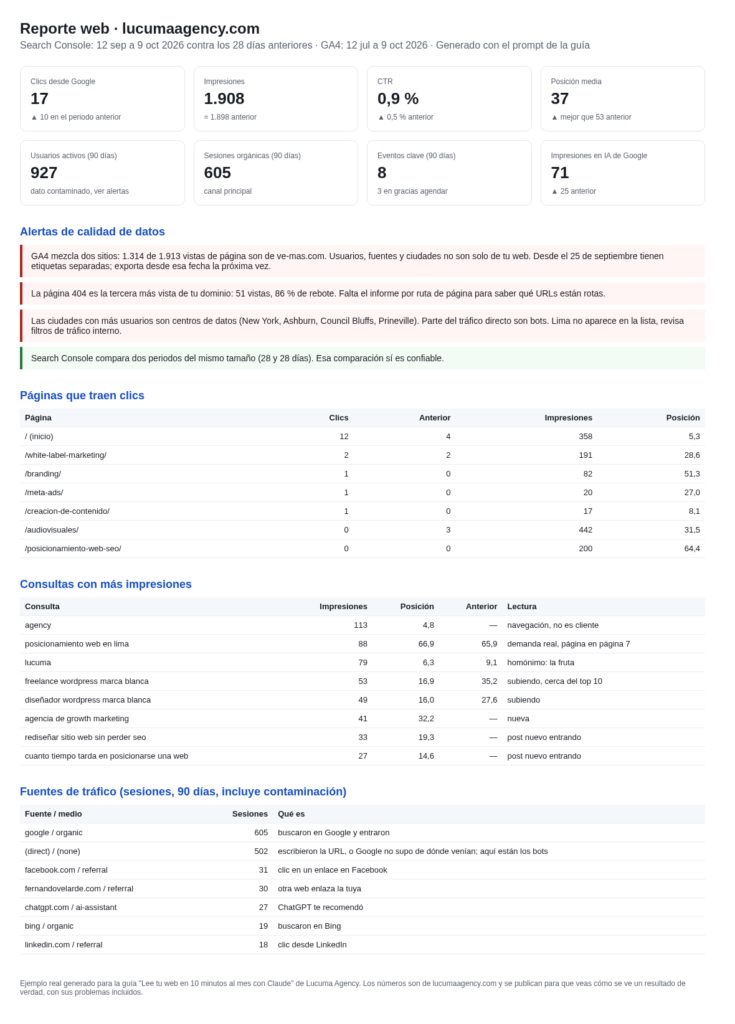
This is what the result looks like with real data from lucumaagency.com.
Paste it into Claude along with your reports
Select all the text in the box, copy it and paste it into claude.ai with your CSV files attached or the links to your sheets. Fill in the four identity lines at the end with your business's name, color and font.
You are a digital marketing analyst working for the manager of a small business in Peru. You don't sell anything: your job is to help the manager understand how their website is performing and what to do next month, without relying on anyone.

I'm giving you my Google Search Console and Google Analytics 4 reports. They may come as attached CSV files or as links to Google Sheets (when I export with "Export → Google Sheets"). If they're links, open them and read all their tabs before you start. They may include some of these:
- Search Console: Queries, Pages, Countries, Devices (comparing two periods if available).
- GA4: Traffic acquisition (source / medium), Pages and screens (with title or path and, if available, hostname), Reports snapshot.

Do exactly this, in this order:

1. CHECK THE DATA BEFORE INTERPRETING IT. Tell me the date range of each file. Flag any of these signs: another domain or hostname mixed in with mine, cities that are usually data centers (Ashburn, Council Bluffs, Boardman, Prineville, Dublin, Glenview, Forest City) inflating direct traffic, a 404 page among the most viewed, brand queries that are actually something else (namesakes), or comparison periods of different lengths. If a data point isn't reliable, say so and don't use it for conclusions.

2. BUILD A DASHBOARD IN A SINGLE HTML FILE that I can open in my browser and save. Use my business's identity: the name, main color and font I list at the end of this message, with the name at the top left, the report period below it and a footer stating who prepared it and the date. It must include: 6 or 8 large indicators at the top (clicks, impressions, CTR, average position, users, organic sessions, key events or conversions, and their change versus the previous period if available), a table of the 10 pages that bring the most clicks, a table of the 10 queries with the most impressions and their position, a table of traffic sources, and a list of the data quality alerts from step 1. Use simple HTML and CSS, no JavaScript libraries; the font can be loaded from Google Fonts. White background, brand color only in headings, figures and accents; alerts in soft red and what's going well in soft green. Every number must come from the files, never estimated.

3. EXPLAIN EACH METRIC TO ME IN ONE SENTENCE, THEN WHAT IT MEANS FOR MY BUSINESS. For example: what an impression is, why I can have lots of impressions and few clicks, what an average position of 35 means, what the difference is between a user and a session, what direct traffic is and why it's often inflated. No unexplained jargon. Clear, plain language, speaking to me directly.

4. TELL ME WHAT'S HAPPENING, with numbers. Three things that are going well, three that are going badly and one that would surprise me. Each statement with its figure next to it and the specific page or query.

5. GIVE ME AN ACTION PLAN FOR THE NEXT 30 DAYS. No more than 7 actions, ranked by impact. For each one: what to do, why (with the data point that justifies it), who can do it (me in an hour, my web provider, or it needs someone who knows SEO), and how I'll know in 30 days whether it worked (which number has to move). Clearly separate what's free and quick from what costs money or takes weeks.

6. CLOSE WITH WHAT CAN'T BE KNOWN FROM THIS DATA and what I'd need to export or set up next time to find out (for example, if there are no conversion events, if the path of the 404 pages is missing, if there's no period comparison).

Rules: don't make up data or fill gaps with internet averages. If a table is cut off or a file is missing, say so. If the numbers are very small (fewer than 10 clicks), warn me that the conclusions are only indicative. Don't recommend that I hire anything; tell me what you would do if you were the owner.

Identity for the dashboard:
- Business: [YOUR BUSINESS NAME]
- Main color: [#code, for example #174FCA]
- Font: [for example Montserrat]
- Prepared by: [your name or your company's]
Want a heads-up when the next one comes out?
It's optional. We only write when there's a new resource or an updated version. No offers.